Data extracted in April 2025.
Planned article update: June 2026.
Highlights
This article is a part of a set of statistical articles, which are based on the Eurostat publication ’Sustainable development in the European Union — Monitoring report on progress towards the SDGs in an EU context — 2025 edition’. This report is the ninth edition of Eurostat’s series of monitoring reports on sustainable development, which provide a quantitative assessment of progress of the EU towards the SDGs in an EU context.
Leave no one behind is one of the core principles of the 2030 Agenda. It emphasises the need to reduce the various forms of inequalities that exist within and among countries. Inequalities undermine the potential of specific regions, population groups and individuals and their connection to the sustainable development goals (SDGs). Moreover, regions play a crucial role in delivering the SDGs because they can tailor the implementation actions to local needs, contexts and challenges.
This section takes an in-depth look at disparities across European regions for six selected indicators from the economic, social and environmental dimensions of sustainability. It does so by showcasing differences at NUTS 2 or NUTS 3 regional level [1]. For some indicators, regional disparities are also assessed by calculating the ratio of the region with the highest or lowest value within a country to the country average. More detailed data and analyses at regional level can be found in Eurostat’s regional yearbook, in the Regions in Europe interactive publication as well as in Eurostat’s statistical atlas.
Employment rate
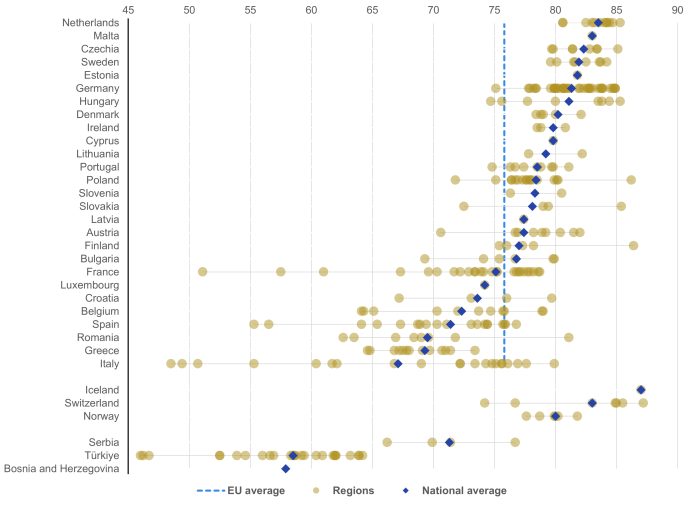
In 2024, the EU’s employment rate was 75.8%, which was already quite close to the 78% target set for 2030. However, significant disparities in employment rates exist between Member States. Central and northern European countries showed the highest rates, while southern and eastern European countries had the lowest rates (see the analysis in the article on SDG 8 ‘Decent work and economic growth’).
More than 45% of EU regions have employment rates above the 78% EU target
At a regional level, the highest employment rate in 2024 was reported for Åland in Finland with 86.4%, followed by the Polish capital region ‘Warszawski stołeczny’ with 86.2% and the Slovak capital region ‘Bratislavský kraj’ with 85.4%. Further regions with employment rates around 85% were in Hungary (‘Budapest’), the Netherlands (‘Utrecht’ and ‘Zeeland’), Czechia (‘Praha’) and Germany (‘Oberbayern’, ‘Schwaben’, ‘Mittelfranken’, ‘Trier’). More than 45% of the EU regions had an employment rate above the EU target level of 78%.
Italy, France and Spain showed considerable within-country disparities across NUTS 2 regions (see Figure 1). For France and Spain, this is mainly due to the French overseas regions and the two Spanish enclaves in Africa, which had considerably lower employment rates than the rest of the country. For Italy, the large disparity is due to its southern regions ‘Campania’, ‘Calabria’ and ‘Sicilia’, which had employment rates around 50% in 2024. These three countries consequently also had the largest differences between the region with the lowest employment rate and the national average. In 2024, this ratio amounted to around 1.5 for France, 1.4 for Italy and 1.3 for Spain. In all other Member States, this ratio was close to 1.1 or lower.
Source: Eurostat (lfst_r_lfe2emprt)
Employment rate was up in almost all EU regions during the last five years
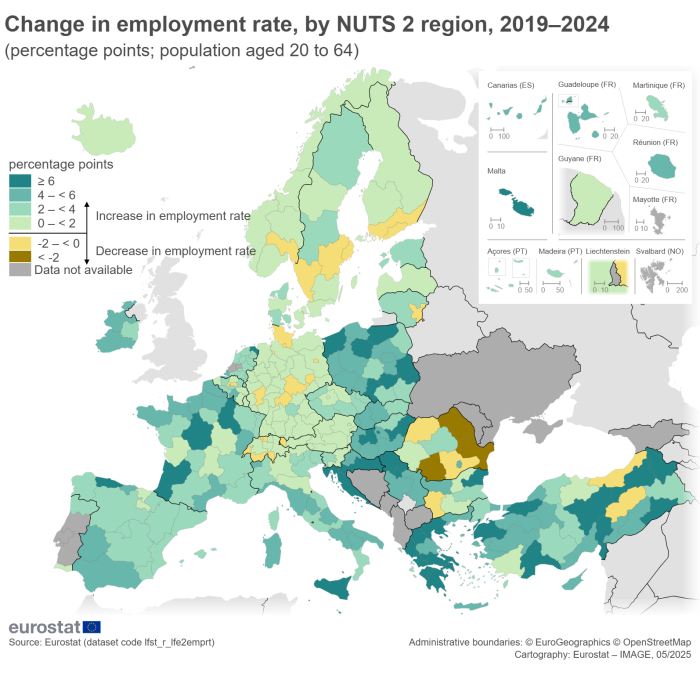
Between 2019 and 2024, the EU’s employment rate increased by 2.7 percentage points, making good progress towards the 78% target (see the analysis in the article on SDG 8 ‘Decent work and economic growth’). As shown in Map 1, this is the result of increasing employment levels in almost all EU regions. Only 23 out of 243 regions with available data experienced a reduction in their employment rate, most of which were located in Germany (eight regions), Romania (five regions) and Sweden (three regions). The reduction was strongest in the Romanian regions ‘Nord-Est’, ‘Sud-Vest Oltenia’ and ‘Sud-Est’, with employment rates falling by 9.9 percentage points (pp), 5.5 pp, and 2.8 pp, respectively. In all other regions experiencing a reduction in their employment rate during this period, the decrease amounted to 2.0 pp or less. In contrast, the employment rates in regions in Greece, Croatia and Poland increased most over this period. The Greek regions ‘Dytiki Elláda’, ‘Kentriki Makedonia’ and ‘Attiki’ reported the strongest increases, with 13.6 pp, 9.6 pp and 9.1 pp, respectively.
With respect to the reduction of within-country disparities, the Italian, French and Spanish regions with the lowest employment rates generally increased their rates between 2019 and 2024 (with the exception of ‘Ciudad de Melilla’), but their improvements were not always higher than in other regions in these countries. Therefore, further efforts will be necessary to meet the 2030 Agenda’s principle to leave no one behind.
Source: Eurostat (lfst_r_lfe2emprt)
Risk of poverty or social exclusion
The 2030 Agenda calls for poverty in all its dimensions to be halved by 2030. In line with this target, the EU uses a multidimensional measure of poverty and social exclusion, covering monetary poverty (at-risk-of-poverty rate), severe material and social deprivation, and very low work intensity. In 2023, more than a fifth (21.3%) of the EU population was affected by at least one of these dimensions and thus considered at risk of poverty or social exclusion (see the analysis in the article on SDG 1 ‘No poverty’). At Member State level, this rate ranged from 12% in Czechia to more than 30% in Bulgaria and Romania.
The risk of poverty or social exclusion was highest in regions in south-eastern Europe
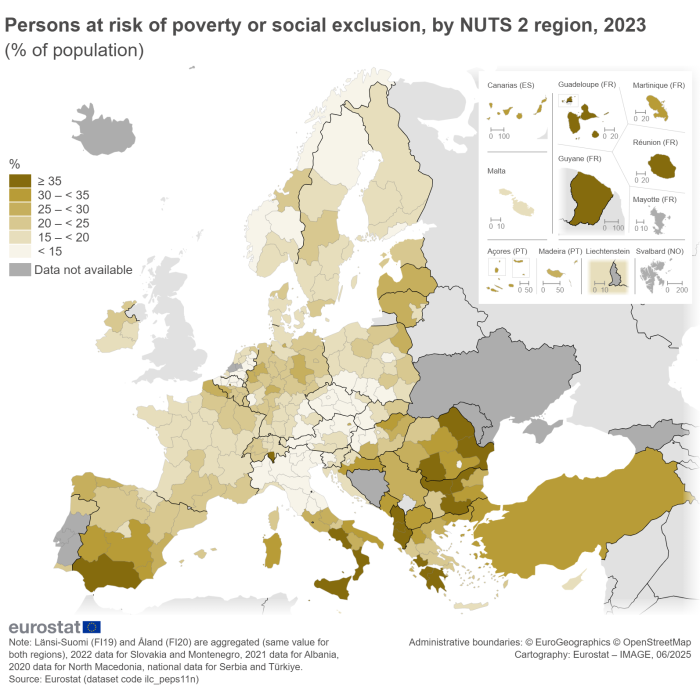
The regions with the lowest employment rates across the EU (see above) also tend to have the highest rates of poverty or social exclusion. In 2023, the French overseas regions ‘Guyane’ and ‘La Réunion’, the south Italian regions ‘Campania’, ‘Calabria’ and ‘Sicilia’ and the Spanish enclave ‘Ciudad de Ceuta’ were all among the regions with the highest at-risk rates of more than 40%. ‘Guyane’ had the highest rate, with 60.3% of the population being at risk, followed by ‘Calabria’ in Italy with 48.6% and ‘Sud-Est’ in Romania with 45.3%. In 19 EU regions more than a third of the population was at risk of poverty or social exclusion in 2023 (see Figure 2); these regions were mainly located in Spain (4 regions) as well as in Bulgaria, France, Italy and Romania (three regions each). Notably, this also includes the Belgian capital region ‘Région de Bruxelles-Capitale/Brussels Hoofdstedelijk Gewest’, where 37.6% of the population was at risk.
A look at the EU regions with the lowest rates of poverty or social exclusion confirms the strong within-country disparity in Italy already seen for employment. In 2023, only 5.8% of the population in ‘Provincia Autonoma di Bolzano/Bozen’ was at risk of poverty or social exclusion, followed by ‘Emilia-Romagna’ with 7.4%. Overall, there were 50 regions in the EU where less than 15% of the population was at risk in 2023 (see Map 2). These regions were mainly located in central Europe, covering northern Italy, Austria, Czechia, the western parts of Slovakia and Hungary and southern Poland. A second cluster of regions with low at-risk rates covered the Netherlands and the north of Belgium (excluding the capital region of Brussels).

Source: Eurostat (ilc_peps11n)
Source: Eurostat (ilc_peps11n)
Research & development intensity
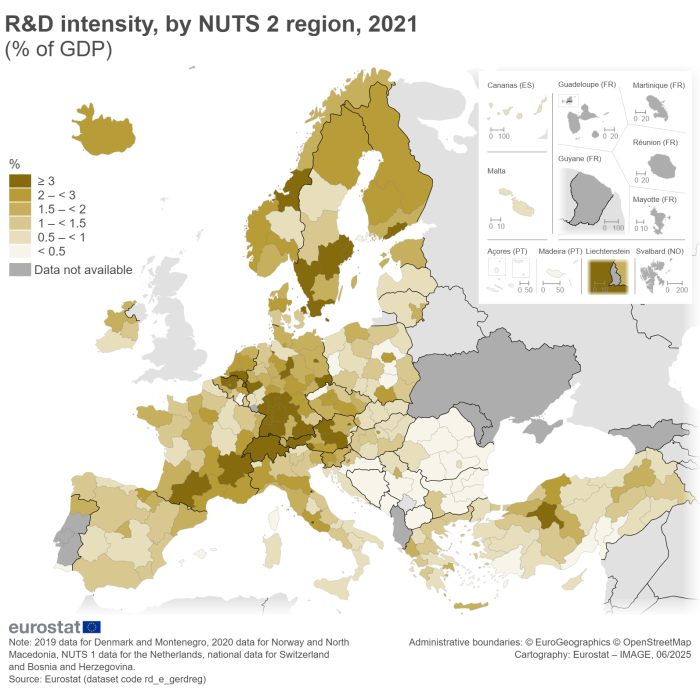
Research and development (R&D) intensity measures gross domestic expenditure on R&D as a share of gross domestic product (GDP). In 2021, the EU’s R&D intensity amounted to 2.24%, which is only slightly above the values recorded in earlier years and far from the long-standing EU target to increase R&D intensity to 3% (see the analysis in the article on SDG 9 ‘Industry, innovation and infrastructure’).
Large differences in R&D intensity exist between EU regions
The pattern of R&D intensity at regional level (see Map 3) reveals a skewed picture, as R&D activities tend to be concentrated in clusters. Research-intensive regions are often situated around academic institutions, science parks, high-technology industrial activities and/or knowledge-based services. The concentration of competitive and cooperative enterprises in related activities attracts start-ups, other market players and highly qualified personnel, which, in turn, drives the creation of new technologies and innovative output. Conversely, R&D activities tend to be lowest in predominantly rural regions and small islands.
In 2021, the highest R&D intensity across the EU was reported by the Belgian region ‘Prov. Brabant Wallon’, with 11.39%, followed by the German regions ‘Stuttgart’, ‘Braunschweig’ and ‘Tübingen’ with 6.81%, 6.09% and 5.47%, respectively. Less than a quarter of the regions for which data are available (54 out of 232 regions) reported an R&D intensity above the EU level of 2.24%. Only 30 regions exceeded the 3% target, most of which were in Germany (14 regions) and in Austria, Belgium and Sweden (four regions each). In contrast, R&D intensity was lowest in regions in eastern Europe, mainly in Romania, Bulgaria and Poland.
Gross domestic product
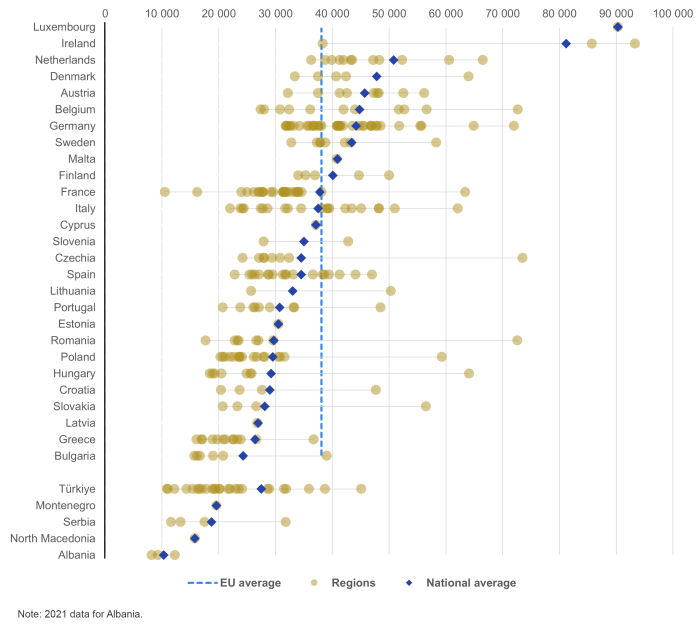
In 2023, the EU’s GDP amounted to 38 100 purchasing power standards (PPS) [2] per inhabitant. At Member State level, Luxembourg and Ireland by far exceeded the per capita GDP levels of all other EU countries, with values of 90 300 PPS and 81 200 PPS, respectively. At the other end of the scale were Latvia, Greece and Bulgaria, with values below 27 000 PPS per inhabitant.
Largest regional disparities in GDP per inhabitant were in France and Ireland
At regional (NUTS 2) level, the two Irish regions ‘Eastern and Midland’ and ‘Southern’, followed by the Czech capital region ‘Praha’ reported the highest per capita GDP levels (see Figure 3). In contrast, the French overseas region ‘Mayotte’ had the lowest GDP per inhabitant across the EU. When excluding the EU’s outermost regions, the lowest levels were generally found in south-eastern Europe, especially in Bulgaria and Greece. Capital regions usually had the highest GDP levels, even though this pattern is not true for all countries (for example, in Germany, Italy and Austria).
France had the largest difference between the national average and the region with the lowest GDP per inhabitant (‘Mayotte’), with a ratio of 3.6. In Ireland, the ratio of the national average to the lowest region was 2.1, while this ratio was below 2 in all other Member States.
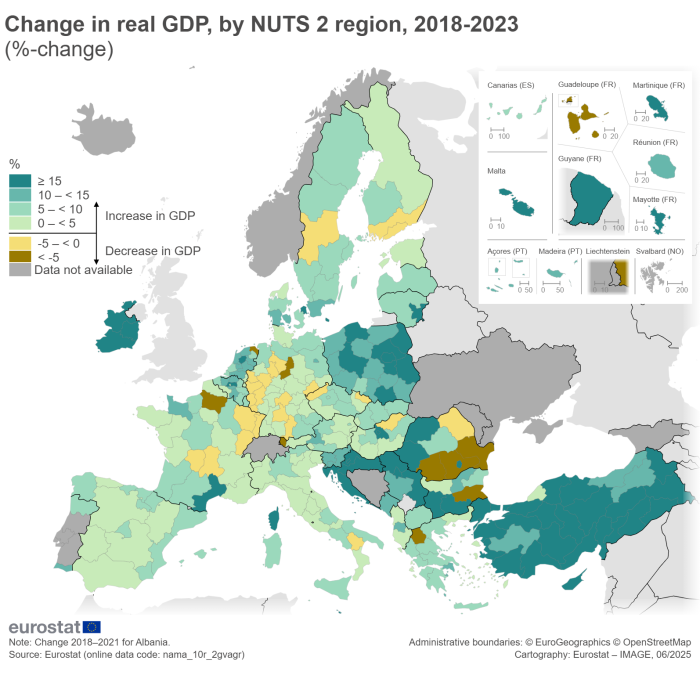
Several poorer regions caught up between 2018 and 2023
Between 2018 and 2023, the EU economy grew by 6.3% in real terms (meaning the effects of inflation have been removed). As shown in Map 4, this is the result of economic growth in most EU regions. The strongest GDP growth took place in the French overseas region ‘Mayotte’, with 58.5%, followed by the Romanian capital region ‘Bucureşti-Ilfov’ with 43.7% and the Irish ‘Northern and Western’ region with 43.2%. In contrast, several regions in Germany and France experienced a decrease in GDP between 2018 and 2023. GDP declined most in the French overseas region ‘Guadeloupe’, by 21.6%, followed by ‘Dytiki Makedonia’ (Greece) and ‘Groningen’ (Netherlands) with decreases of 15.0% and 12.6%, respectively. Overall, regions in south-eastern Europe — which had the lowest GDP per inhabitant levels across the EU — and in Ireland have experienced the strongest growth across the EU since 2018. This suggests that economic disparities across EU regions have been narrowing (at least in part) in recent years (also see the analysis of disparities in GDP per capita in the article on SDG 10 ‘Reduced inequalities’).
Source: Eurostat (nama_10r_2gvagr)
Premature deaths due to air pollution
According to the World Health Organization (WHO), air pollution is a major cause of mortality and disease and the largest single environmental health risk in Europe. Fine particulate matter (PM2.5) is the most harmful air pollutant from a health perspective. PM2.5 refers to particulates less than 2.5 micrometres in diameter. These can be carried deep into the lungs where they can cause inflammation and exacerbate the condition of people already suffering from heart and lung diseases. PM2.5 is emitted mainly from the combustion of solid fuels for domestic heating, industrial activities and road transport, but it can also come from natural sources and can form in the atmosphere. The EU aims to reduce the number of premature deaths — meaning deaths that occur before the expected age of death — caused by air pollution by 55% by 2030, compared with 2005 (see the analyses in the articles on SDG 3 ‘Good health and well-being’ and on SDG 11 ‘Sustainable cities and communities’ [3].
Premature deaths due to air pollution were highest in southern and eastern Europe
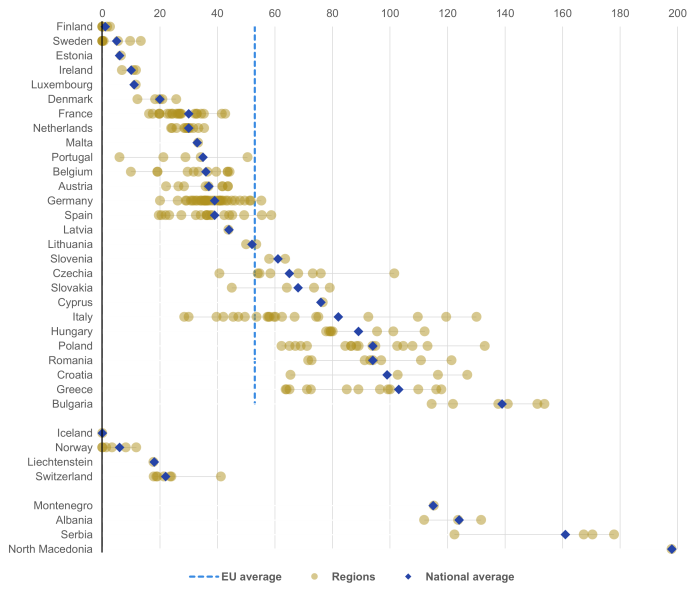
In 2022, long-term exposure to fine particulate matter led to around 239 000 premature deaths in the EU, which equals a rate of 53 deaths per 100 000 inhabitants. As shown in Figure 4 and Map 5, differences between countries tend to be more pronounced than the regional spread within countries. The lowest number of premature deaths due to PM2.5 exposure are reported in northern European countries, especially in Finland, Sweden and Estonia. Some regions in Finland and Sweden had premature death rates close to zero in 2022. In contrast, countries in southern and eastern Europe — especially Bulgaria, Greece, Croatia, Romania and Poland — experienced the highest numbers of premature deaths.
At regional NUTS 2 level (see Figure 4), the rates of premature deaths were highest in the Bulgarian regions ‘Severozapaden’ and ‘Yugozapaden’, with more than 150 per 100 000 inhabitants. Another hotspot was northern Italy, with ‘Lombardia’, ‘Veneto’ and ‘Piemonte’ having rates between 110 and 130 premature deaths in 2022. At NUTS 3 level (see Map 5), the Bulgarian region ‘Vidin’ reported the highest rate, with 217 premature deaths per 100 000 inhabitants, more than four times the EU average. Of the 10 regions (at NUTS 3 level) with the highest rates of premature deaths in 2022, six were in Bulgaria and the remaining four were in Poland (two regions), Italy and Croatia [4].
According to a 2025 analysis on Europe’s air quality status by the European Environment Agency (EEA), the use of solid fuels, such as coal and wood, and an older vehicle fleet are the main reasons for the unfavourable situation in eastern Europe. In northern Italy, air pollution by PM2.5 results from the combination of a high density of anthropogenic emissions and meteorological and geographical conditions that favour the accumulation of air pollutants in the atmosphere and the formation of secondary particles.
Source: European Environment Agency (calculation of ‘per 100 000 inhabitants’ data based on population data from Eurostat (demo_r_gind3)

Source: European Environment Agency (calculation of ‘per 100 000 inhabitants’ data based on population data from Eurostat (demo_r_gind3)
Drought impact on ecosystems
Severe and frequent droughts can increase the risks of water scarcity with detrimental effects on water supply for households, agriculture, energy and industry, as well as on ecosystems and biodiversity. In this report, drought impact is analysed by monitoring anomalies in vegetation productivity in areas with a soil moisture deficit during the growing season (see the analyses in the chapters on SDG 15 ‘Life on land’ and on SDG 6 ‘Clean water and sanitation’).
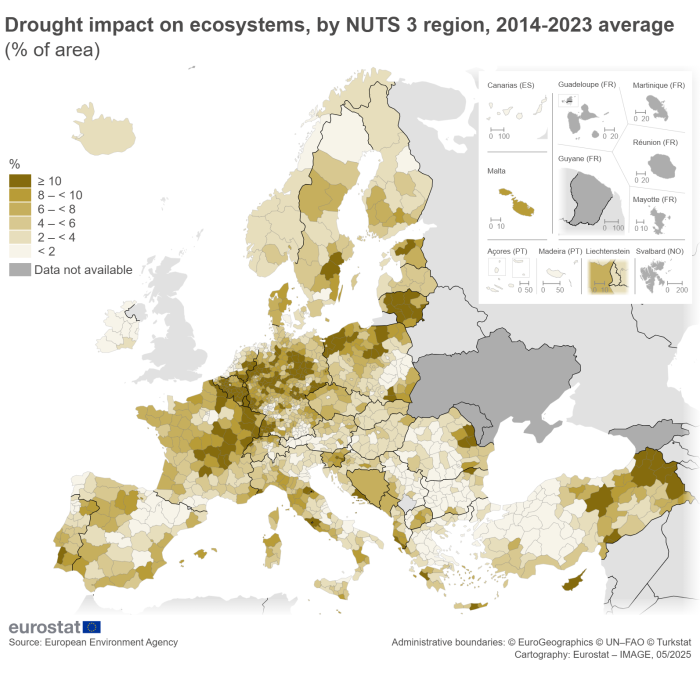
In 2023, Europe experienced its second warmest year on record [5]. Furthermore, more than 143 000 square kilometres or 3.6% of the EU area was affected by drought. As shown in Map 6, these areas were mainly located in north-eastern Europe — spanning from northern Poland over the Baltic countries to Finland and Sweden — and in the southern parts of France, Spain and Portugal. At Member State level, Lithuania was hit hardest, with almost a third of the country area affected by drought in 2023, followed by Estonia with 16% and Latvia with 11%.
The extent of drought varies strongly between European regions
At regional NUTS 3 level, 15 out of the 1 161 regions for which data are available had more than 30% of their area affected by drought in 2023 (see Map 6). These regions were mainly located in Lithuania (seven regions), Poland (five regions), Spain (two regions) and Italy (one region). Across the EU, the Italian region ‘Imperia’ was by far hit the hardest, with almost 60% if its area impacted in 2023. In contrast, 924 regions (80% of all EU regions with available data) reported less than 1% of their area being affected by drought in that year.
As the occurrence of drought fluctuates strongly from year to year, a look at the average over several years can provide a better understanding. Map 7 shows how European regions were on average affected by drought over the period from 2014 to 2023. The northern parts of central Europe — spanning from northern France over northern Germany, northern Poland and the Baltic countries — were generally more concerned. Over these 10 years, 23 regions had on average more than 15% of their area affected by drought. These were mainly located in Germany (11 regions), Belgium (eight regions), the Netherlands (three regions) and Luxembourg. The Belgian region ‘Arr. Namur’ was hit hardest, with on average a quarter of its area affected. In contrast, around 20% of all EU regions (218 of the 1 161 regions with available data) had on average less than 2% of their area affected by drought over the same period.
Footnotes
- ↑ NUTS (nomenclature of territorial units for statistics) is a geographical nomenclature dividing countries into regions at three different levels (NUTS 1, 2 and 3 respectively, moving from larger to smaller territorial units in terms of population). For more information about the NUTS classification, see the respective metadata.
- ↑ PPS is an artificial currency unit that allows comparing countries and regions by adjusting for price level differences, so that — theoretically — one PPS can buy the same amount of goods and services in each country. For the EU average, values in PPS equal values in EUR, meaning the EU’s GDP was EUR 38 100 per inhabitant in 2023.
- ↑ Further data on main environmental pollution indicators addressing health, ecosystem protection and biodiversity, as well as production and consumption, are available in a new Zero Pollution Dashboard.
- ↑ Further data on concentrations and health risks related to exposure to main pollutants at NUTS 3, country and city level are available in the EEA geospatial data catalogue ‘Air Quality Health Risk Assessments’.
- ↑ Copernicus Programme (2024), ESOTC 2023 | Europe | Temperature and thermal stress.
Explore further
Other articles
Database
Thematic section
Methodology
More detailed information on EU SDG indicators for monitoring of progress towards the UN Sustainable Development Goals (SDGs), such as indicator relevance, definitions, methodological notes, background and potential linkages can be found in the introduction as well as in Annex II of the publication ’Sustainable development in the European Union — Monitoring report on progress towards the SDGs in an EU context — 2025 edition’.

